Visualizing SQL data with Metabase
We are previously gathered a bunch of data in a couple of SQL databases. That is all nice and sweet, we can run SQL queries against them and analyze the results, but some queries we might forget and we cannot easily visualize the data in graphs. To help us to this, we will look at Metabase. ![]()
Metabase
Metabase is an open source “business intelligence” tool to help us visualize data. Since we are already using Docker for out Pi-hole, we’ll just continue to host our Metabase instance there as well. The documentation provides a Docker Compose YAML file for us to use so we will get going with that.
Docker compose
Due to Metabase not providing an arm64 image, we are using a customize image by Bobblybook. Loading “random” peoples Docker images, what could go wrong? 
Create DB for Metabase
First off, we need to create a DB for metabase to use. 172.18.0.3 is the IP of my metabase docker instance. We need to give it access to to it’s thing.
CREATE DATABASE metabase CHARACTER SET utf8mb4 COLLATE utf8mb4_unicode_ci;
-- create user
CREATE USER 'metabaseuser'@'172.18.0.3' IDENTIFIED BY 'PASSWORD';
-- grant full access to metabaseuser
GRANT ALL PRIVILEGES ON metabase.* TO 'metabaseuser'@'172.18.0.3';
Starting metabase
- Allow the docker host access to the mariadb port:
sudo ufw allow from 172.18.0.0/16 to any port 3306 - Get the container up with
docker compose up -d- We will be using this docker compose config file.
- Notice that we are using
extra_hostswith- "host.docker.internal:host-gateway"so that our Metabase container can easily resolve the host machine since this is where we are running SQL.
- Now we can visit the site! http://metabase:3000/
Troubleshoot issues with: docker logs -f metabase
Provide read access to Network db
Metabase now needs access to data we want to visualize, so let’s create a new user and grant him permissions:
CREATE USER 'metabasero'@'172.18.0.3' IDENTIFIED BY 'PASSWORD';
-- grant full access to metabasero
GRANT SELECT ON netMon.dns_results TO 'metabasero'@'172.18.0.3';
SHOW GRANTS FOR 'metabasero'@'172.18.0.3';

+--------------------------------------------------------------------------------------------------------------------+
| Grants for metabasero@172.18.0.3                                                                                   |
+--------------------------------------------------------------------------------------------------------------------+
| GRANT USAGE ON *.* TO `metabasero`@`172.18.0.3` IDENTIFIED BY PASSWORD '*' |
| GRANT SELECT ON `netMon`.`dns_results` TO `metabasero`@`172.18.0.3`                                                |
+--------------------------------------------------------------------------------------------------------------------+
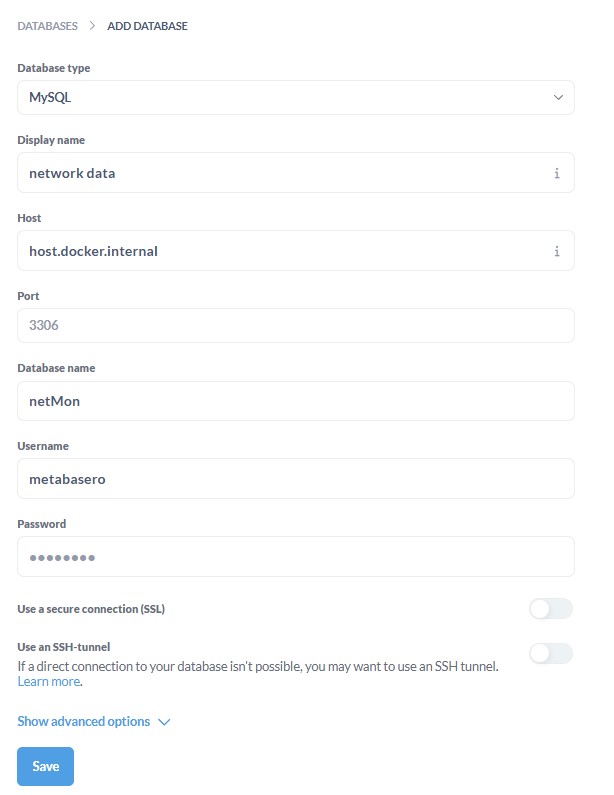
Configure access for Metabase to access the data
Enter the db name, port, credentials and let’s use the host.docker.internal as host.
Visualizing the data
Finally, the moment we have been waiting on, daaaaashboards! ![]()
By just hooking the DB up to metabase, we get some decent, default dashboard. But we want to create our own which is really simple.
We can create new questions which are queries against our own data. We can also create SQL queries to extend the data we are working with, but for this purpose, regular questions works fine.
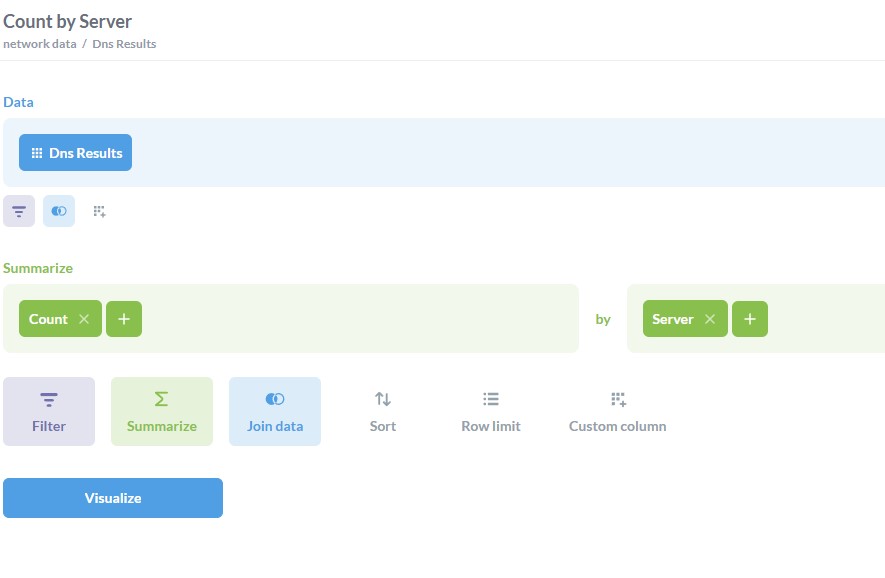
After creating a few relevant questions, we can now place it, along with some graphs on a dashboard and add some filter, like time range to get us a proper dashboard:

Conclusion
They have made setting up Metabase itself, with DB connections, questions and dashboards simple as pie so the main part of this story is all good. But when it comes to looking at the actual DNS response times, I am disappointed. ![]()
DNS Stats:
- Fastest server: Cloudflare (1.1.1.1). Not very surprising, but good to be able to confirm it.

- Slowest and mot unreliable server: Pi-hole (192.168.0.187). Even slower than the local router.. I hoped it would be faster, but I guess being hosted on a Raspberry Pi, in a Docker environment is not the best setup when it comes to speed (even though the network tests themselves are being executed from the same Pi.)

Further work: I would like to start monitoring the local and external connection with a continuous ICMP stream to catch small moments of delays.
tags: sql - monitoring - metabase