Getting started with Cilium & Hubble
Running Kubernetes AND getting L7 network flow logs on a Raspberry Pi. Too good to be true? Nope, we can do it! For a long time, I have wanted to get a good grasp of log data like this. And now is the time! ![]()
Cilium
Cilium is open source software for transparently securing the network connectivity between application services deployed using Linux container management platforms like Docker and Kubernetes.
It uses the hyped up technology - eBPF so that Cilium can get that sweet, good reach into the Linux kernel!
Very easy to install and provides a good status view with cilium status --wait.
k top pods -A:
NAMESPACE     NAME                                      CPU(cores)   MEMORY(bytes)
kube-system   cilium-envoy-5htcv                        3m           16Mi
kube-system   cilium-gss2c                              13m          219Mi
kube-system   cilium-operator-59896f77f9-cxbg2          2m           34Mi
-
cilium: Main agent, enforces policy, manages network, facilitates observability via Hubble etc. -
cilium-envoy: L7 proxy -
cilium-operator: Manages Cilium components; garbage collection, IPAM, coordinates mesh if enabled, etc.
CiliumNetworkPolicy
We can now add a simple DNS policy to get control over the traffic in our namespace. Note the rules which enable L7 visibility!
apiVersion: "cilium.io/v2"
kind: CiliumNetworkPolicy
metadata:
  name: networkpolicy-dns
  namespace: test-app
spec:
  endpointSelector: {}
  egress:
    - toEndpoints:
      - matchLabels:
          "k8s:io.kubernetes.pod.namespace": kube-system
          "k8s:k8s-app": kube-dns
      toPorts:
        - ports:
           - port: "53"
             protocol: ANY
          rules:
            dns:
              - matchPattern: "*"
We will leave this for now, we want to view those fiiiine flow data. ![]()
Hubble
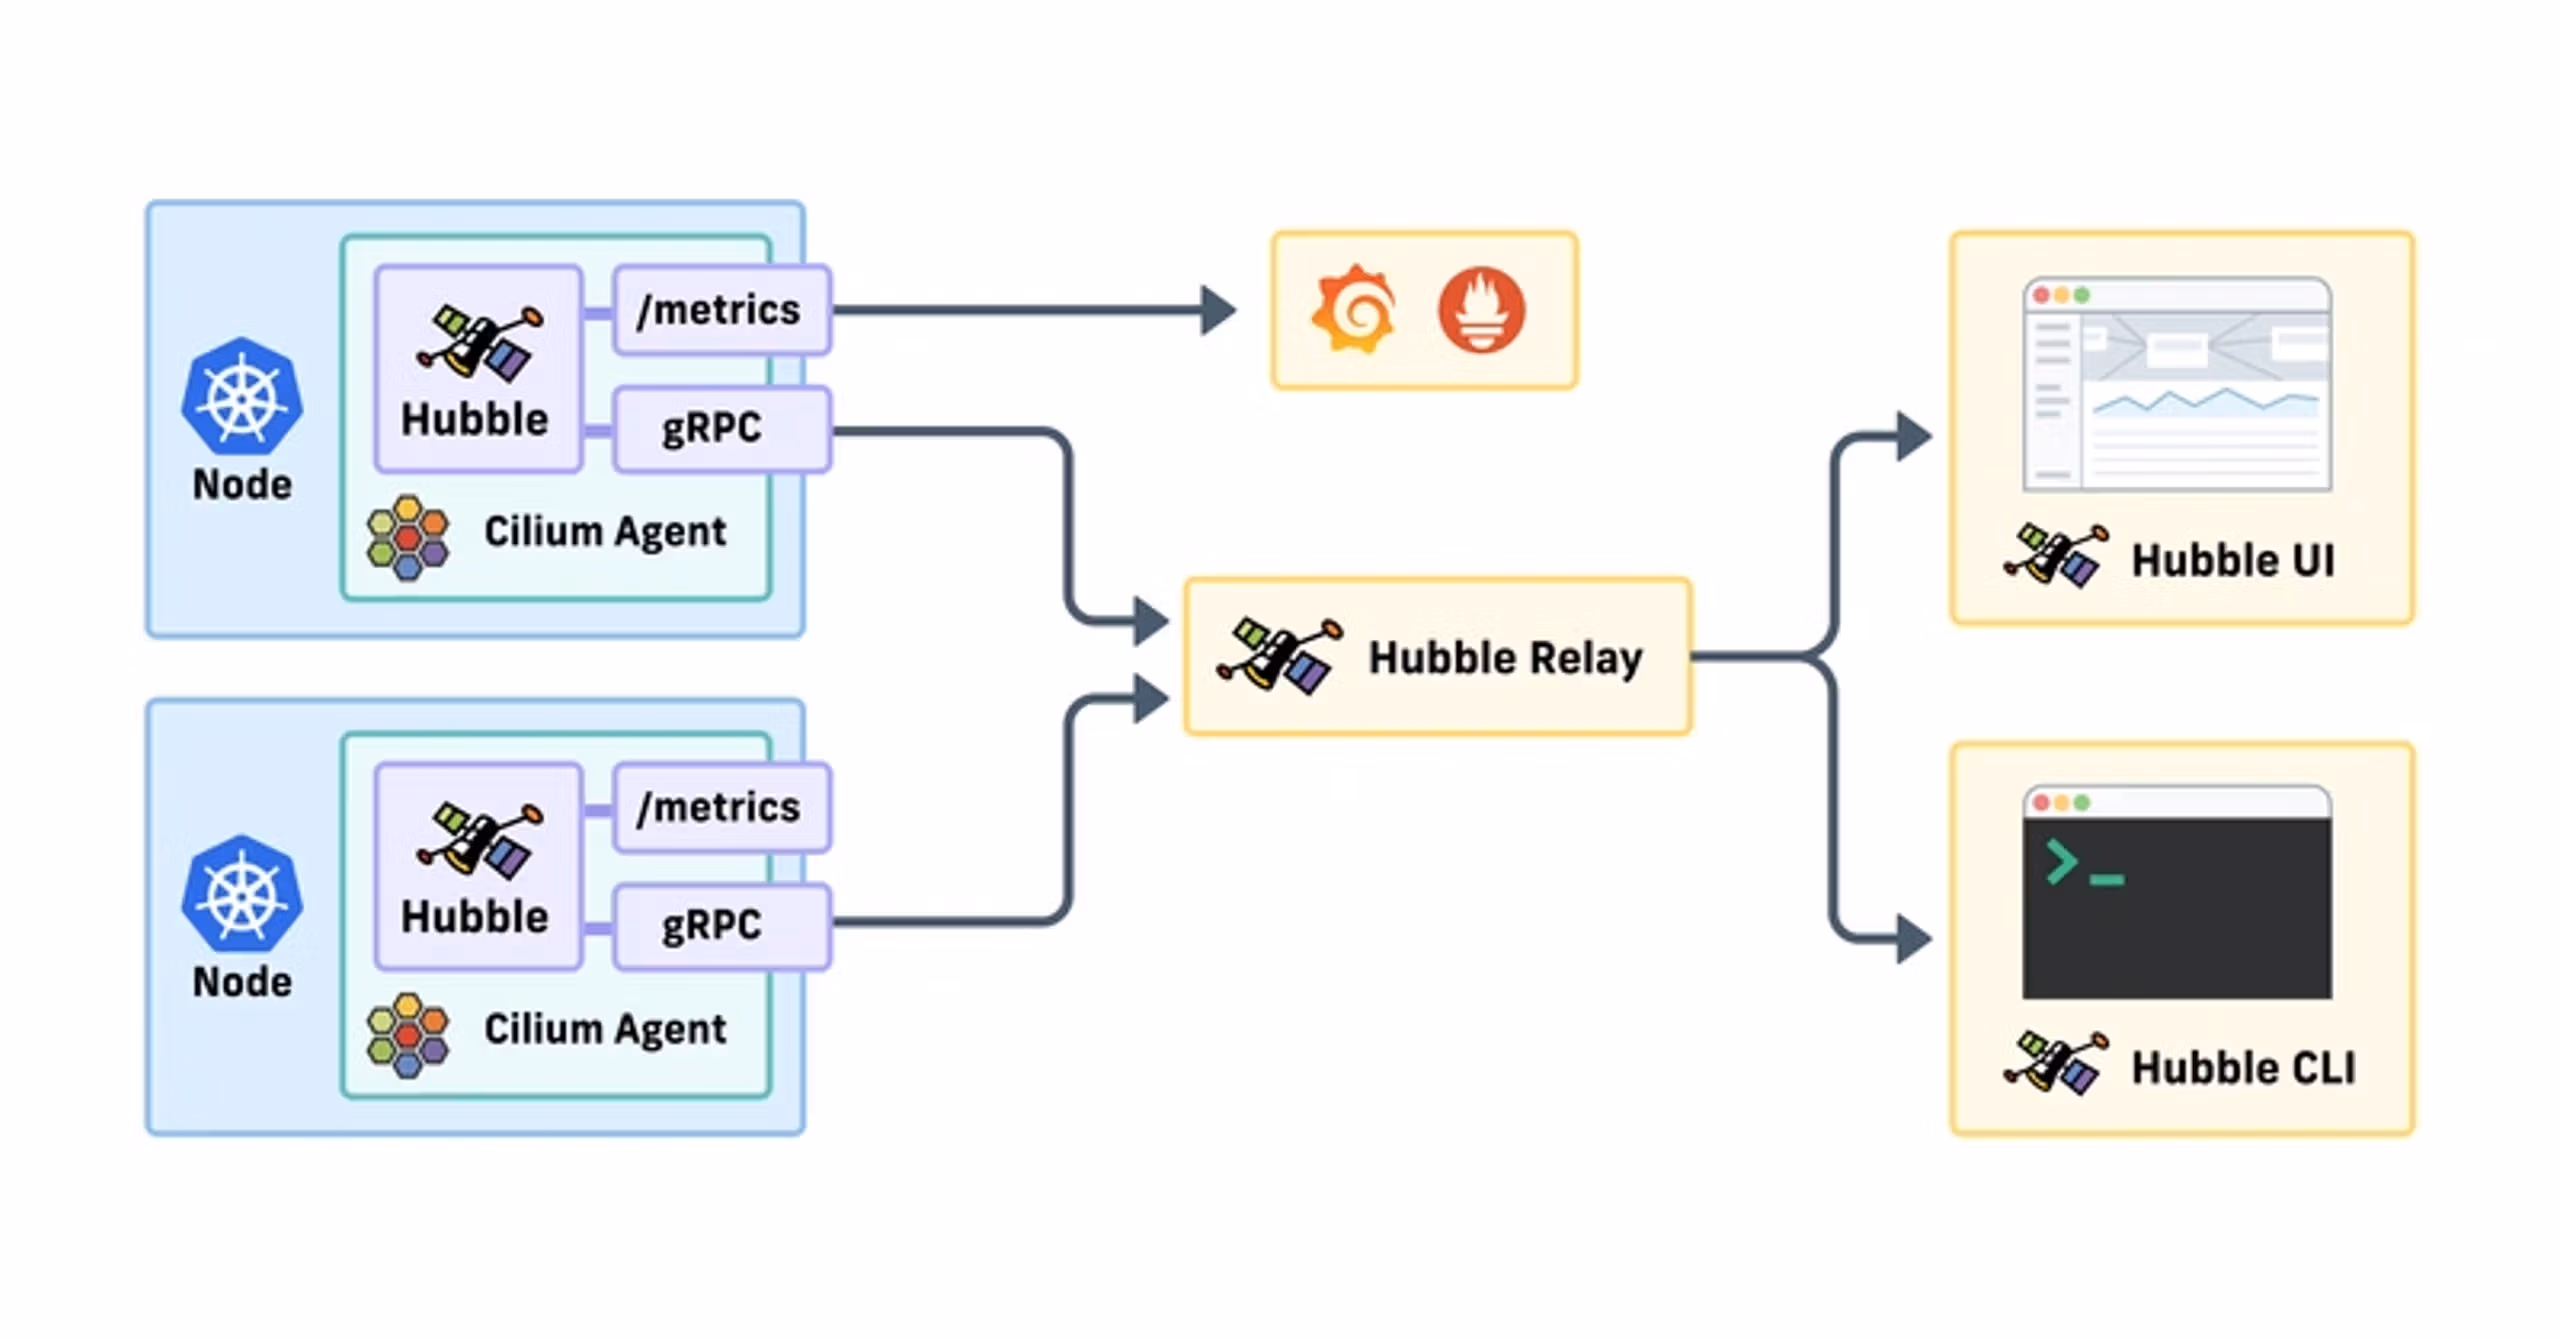
Hubble is the observability layer of Cilium and can be used to obtain cluster-wide visibility into the network and security layer of your Kubernetes cluster.
Each node has a hubble agent which stores network flow logs in memory, the relay aggregates that data. The Hubble UI can “hook” into the relay to view data. It does not store the flows permanently! (We will look at that separately).
Installation
Validate status of the new pod hubble-relay with cilium status and hubble status -P (note the -P which does port-forwarding on the fly to the pod).
hubble status -P
Healthcheck (via 127.0.0.1:4245): Ok
Current/Max Flows: 4,095/4,095 (100.00%)
Flows/s: 18.87
Connected Nodes: 1/1
Let’s view the data!
Send some data - k exec -it -n test-app $(k get pods -n test-app -oname) -- wget https://thebytedungeon.thoren.life/
Then view it:
hubble observe -P -n test-app --pod test-app-6c4465b776-8r86z --last 10 -f:
Dec  2 20:52:42.269: 10.0.0.4:50254 (world) -> kube-system/hubble-relay-848bdc8547-lrrtg:4222 (ID:31709) to-endpoint FORWARDED (TCP Flags: ACK)
Dec  2 20:52:42.649: test-app/test-app-6c4465b776-8r86z:51302 (ID:7935) <> 185.199.110.153:443 (world) policy-verdict:none EGRESS DENIED (TCP Flags: SYN)
Note that we only get the IP and the pod name, not the FQDN of the host.
DNS
hubble observe -P -n test-app --last 10 --protocol dns -f:
Dec  3 18:50:54.339: test-app/test-app-6c4465b776-8r86z:49899 (ID:7935) -> kube-system/coredns-6d668d687-9dnng:53 (ID:7712) dns-request proxy FORWARDED (DNS Query nwt.se. A)
Dec  3 18:50:54.339: test-app/test-app-6c4465b776-8r86z:49899 (ID:7935) <- kube-system/coredns-6d668d687-9dnng:53 (ID:7712) dns-response proxy FORWARDED (DNS Answer  TTL: 4294967295 (Proxy nwt.se. AAAA))
Here we can view the hostname which can be correlated with the IP. Well worth noting is the “proxy”:
A DNS Proxy in the agent intercepts egress DNS traffic and records IPs seen in the responses.
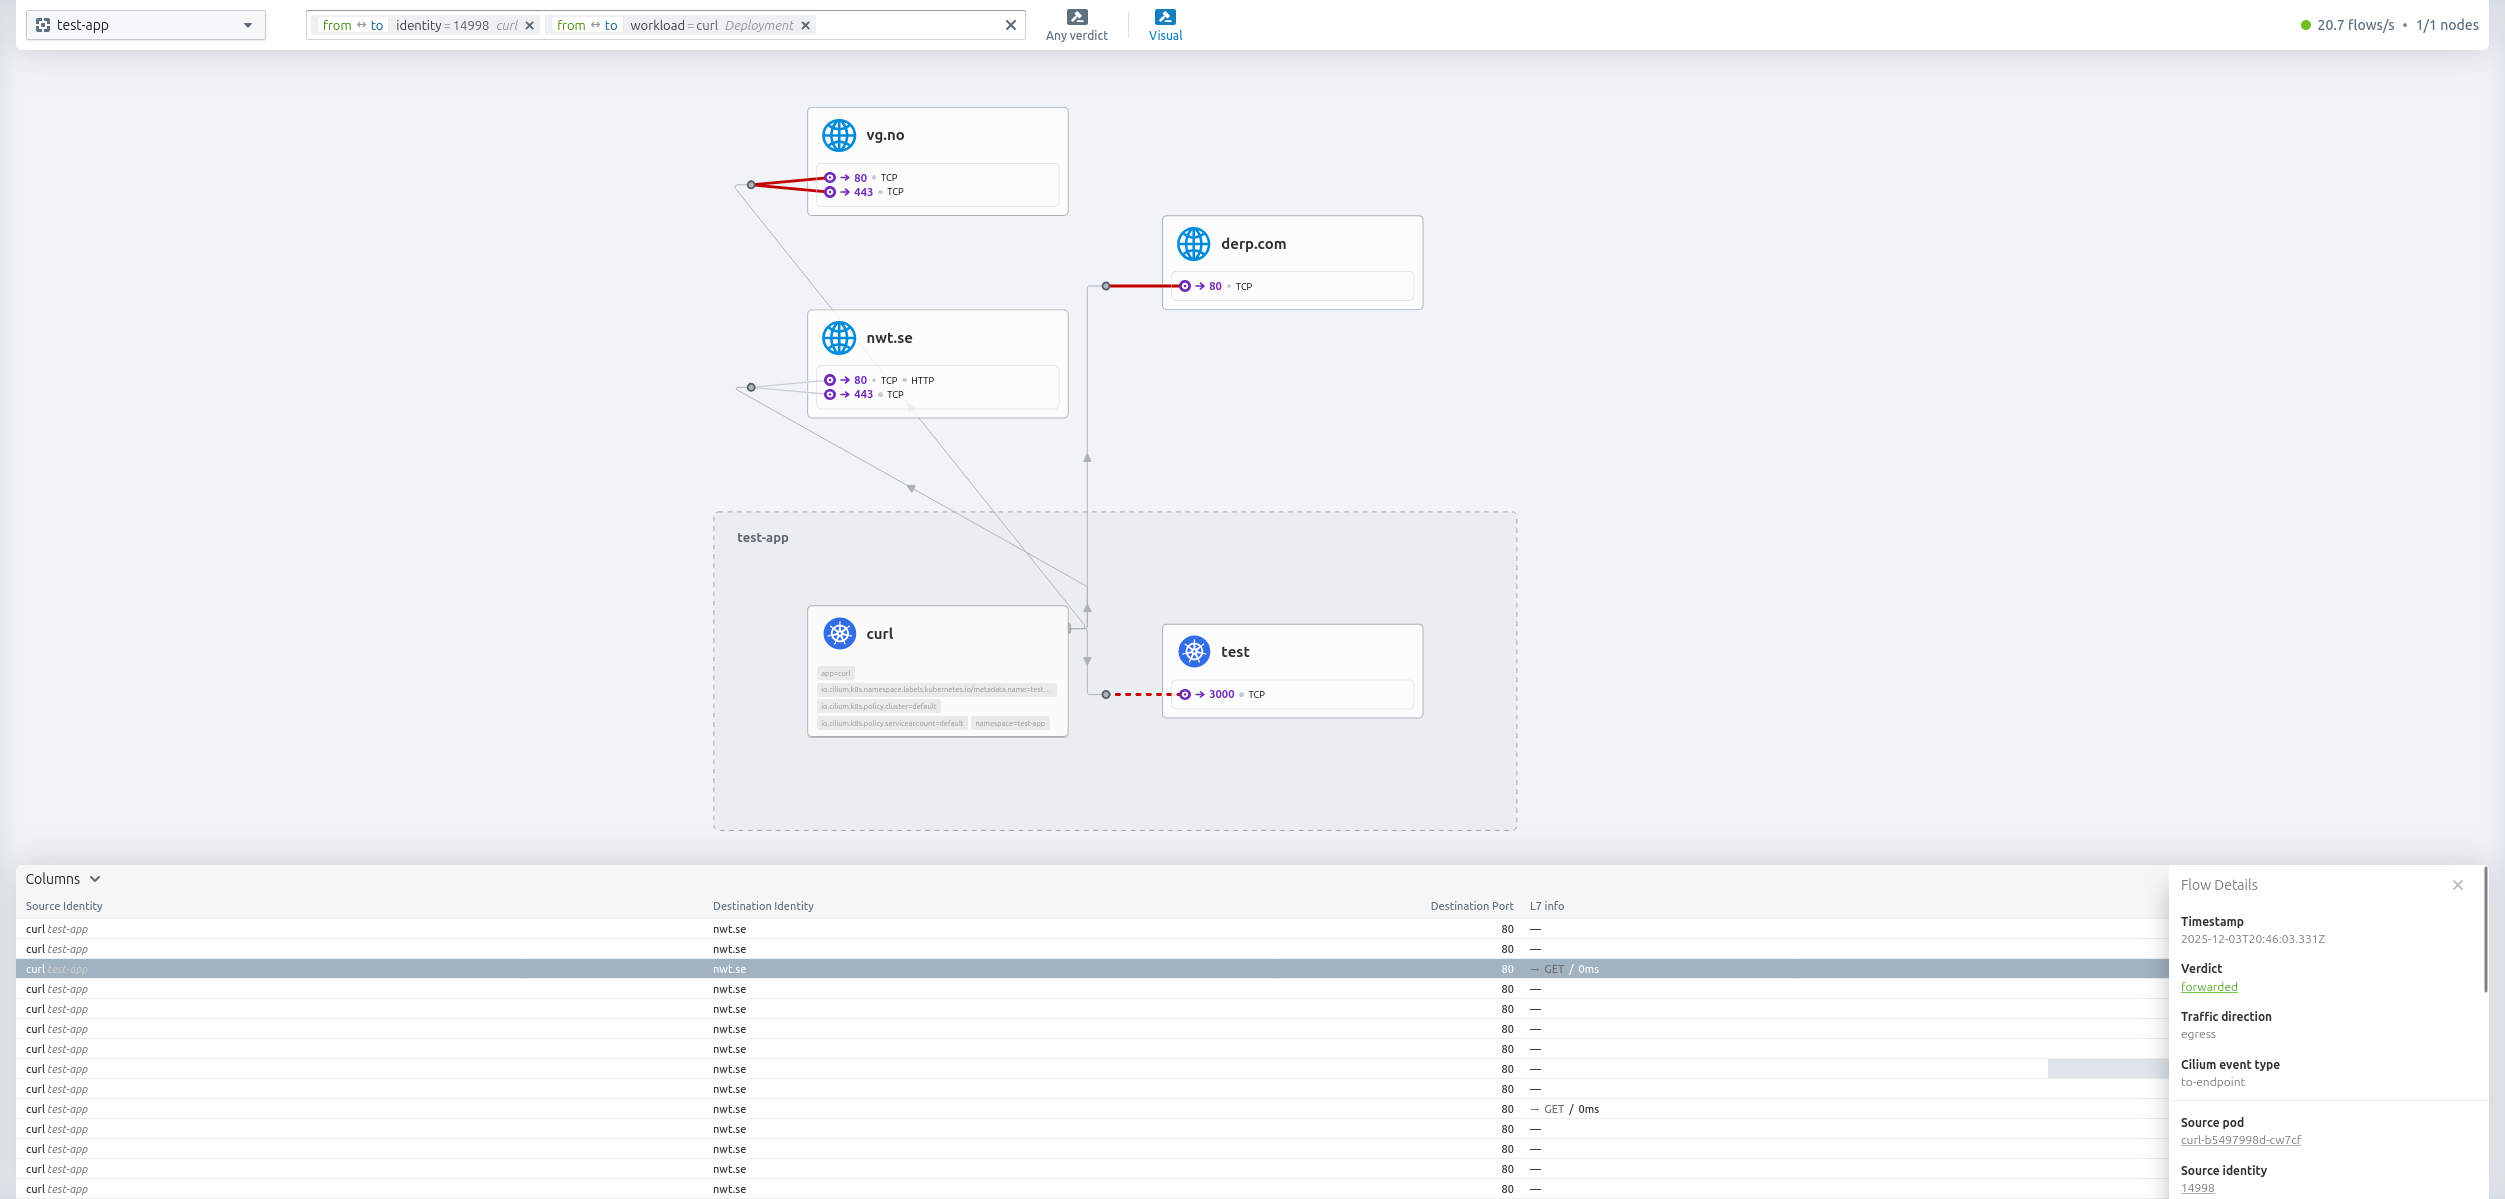
HTTP
hubble observe -P -n test-app --protocol http --last 2:
Dec  3 21:25:03.067: test-app/curl-b5497998d-cw7cf:58466 (ID:14998) -> nwt.se:80 (ID:16777217) http-request FORWARDED (HTTP/1.1 GET http://nwt.se/)
Dec  3 21:25:03.092: test-app/curl-b5497998d-cw7cf:58466 (ID:14998) <- nwt.se:80 (ID:16777217) http-response FORWARDED (HTTP/1.1 301 25ms (GET http://nwt.se/))
Err EVENTS LOST: HUBBLE_RING_BUFFER CPU(0) 1
We often get EVENTS LOST: HUBBLE_RING_BUFFER CPU(0) 1 when listing logs with hubble observe.
Claude:
The ring buffer is circular and automatically overwrites old events. The “EVENTS LOST” message usually means events were dropped because the Hubble CLI couldn’t consume them fast enough, not necessarily that the buffer is full now.
Restarting Cilium helps:
kubectl rollout restart daemonset/cilium -n kube-system
Hubble UI
cilium hubble enable --ui
cilium hubble ui
ℹ️   Opening "http://localhost:12000" in your browser...
Hubble pods resource usage
NAME                                      CPU(cores)   MEMORY(bytes)
cilium-6c94l                              15m          188Mi
cilium-envoy-5htcv                        3m           17Mi
cilium-operator-59896f77f9-cxbg2          2m           35Mi
hubble-relay-848bdc8547-7tshx             2m           25Mi
hubble-ui-6445786767-nbfzn                27m          63Mi
When not using the UI, we can scale down; kubectl scale deployment hubble-ui -n kube-system --replicas=0
Conclusion
There is still much more to do, like log export, detection rules, digging into the network policies etc.
BUT.. wow, this was amazing. I got so much value out of just viewing the flows and setting up some simple network policies.
tags: k3s - raspberry - cilium - hubble